A Spike In Supply Could Tank Multifamily Prices This Year
Commercial real estate is facing stress from several directions. The primary stress is rising interest rates, which are putting upward pressure on cap rates (which pushes down asset values), making refinancing costs increasingly difficult and expensive to come by. But there is another risk arising, specifically to the multifamily niche of commercial real estate: oversupply. Recent data suggests that there may be a short-term glut of multifamily units hitting the market at an inopportune time.
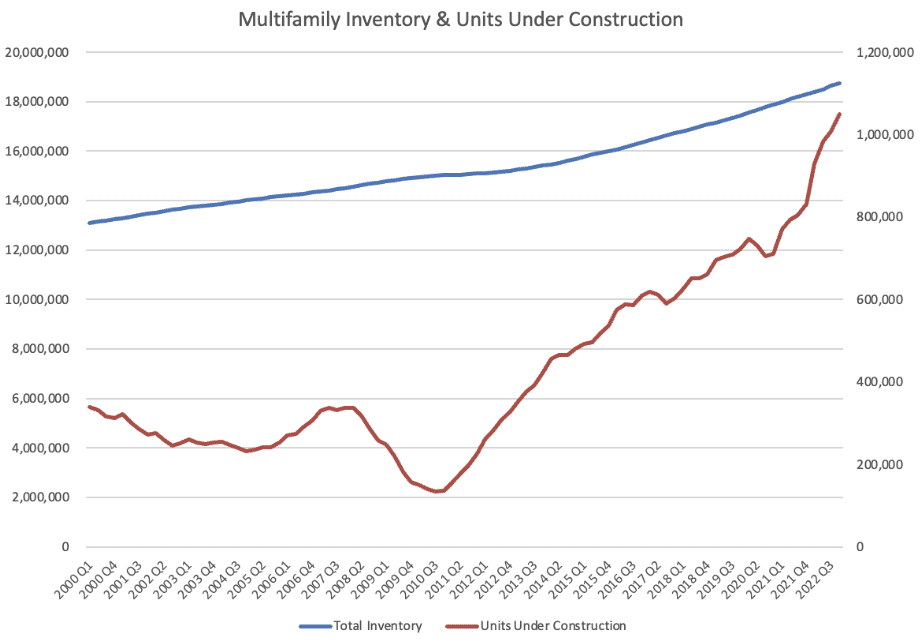
To fully explain this issue, let’s take a look back at construction trends for multifamily properties (defined as properties with five or more units) over the last several decades. As you can see in the graph below, after severe declines in the number of multifamily units from 2008-2014, multifamily construction and the total number of multifamily units have picked up considerably.

Since the beginning of the pandemic, the upward trend of increased multifamily building exploded even further, and as of Q4 2022, surpassed one million units under construction for the first time (at least according to CoStar’s data).
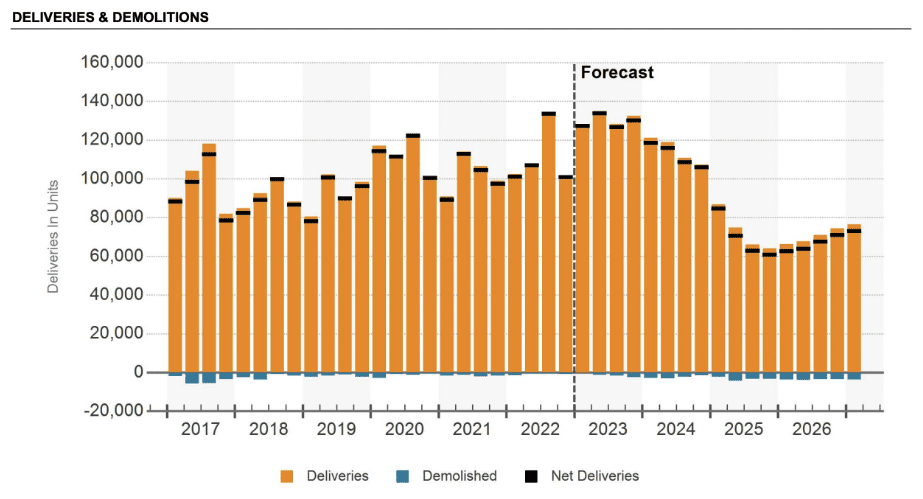
Of course, it takes several months, if not years, to build multifamily units, even in good times. But recent years have not been easy on builders—at least in terms of delivery schedules. With supply chain issues and labor constraints, construction has taken longer. This trend is resulting in a huge glut of inventory that has yet to hit the market. Looking at the chart below, you can see CoStar’s forecast for delivered units shows 2023 being the highest on records, with 2024 coming down a bit but still high. Yes, forecasting is difficult, but forecasting construction deliveries is a bit easier than other datasets. Due to the fact that builders and developers need to get permits for construction, there is solid data about projects that are planned and in the pipeline. Personally, I take this forecast a bit more seriously than I do other forecasts.

An increase in supply is not a problem if there is proportionate demand to “absorb” the new units—but there isn’t. Demand is falling off.
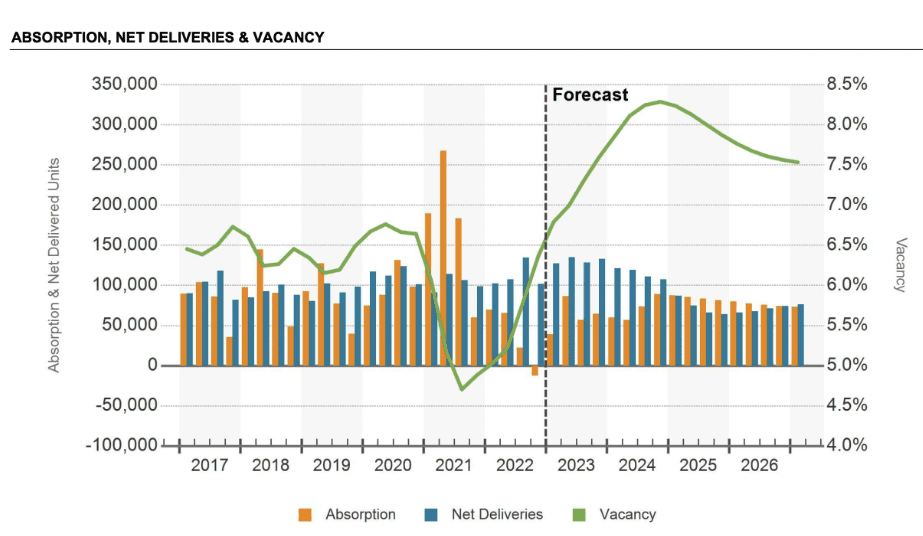
The chart below tells a very compelling story. First, look at the blue bars. That is the same as what we looked at above—high unit deliveries over the next two years. But then look at the orange bars that show “Absorption” (a commercial real estate metric that measures demand). It’s not keeping up.

After a banner year for demand in 2021, “net absorption” (absorption – demand) turned negative, meaning more supply is coming onto the market than there is demand. That was in 2022! In 2023, even more units are expected to come online, and as this graph shows, demand is not expected to keep pace. Of course, some builders could cancel or pause their projects, but it is an expensive proposition that builders tend to avoid if at all possible.
What happens when supply outpaces demand? Vacancy increases, as you can see forecasted in this CoStar projection. This should be a concern to anyone in the multifamily space and to any real estate investor. An increase in supply and a commensurate increase in vacancy can decrease income and push down rental rates. The data I’m showing, and my analysis, is regarding commercial properties, but downward pressure on rents and rising vacancy in multifamily has the potential to spill into the residential market in certain areas.
Of course, this national-level data doesn’t tell the whole story. I took a look at several individual markets to see how this is playing out on a regional level. What I found is that certain markets are at significant risk of overbuilding. I picked a sampling of five markets that I think are at high risk of rising vacancy and rent declines for multifamily: Santa Fe, New Mexico; Punta Gorda, Florida; Myrtle Beach, South Carolina; Colorado Springs, Colorado; and Austin, Texas.
| City | EoY 2024 Demand | Gross Delivered Units 2023/2024 | EoY 2024 Inventory Units | Sum of Absorption Units | Delivered/Inventory | Net Absorption | Net Absorption/Inventory |
|---|---|---|---|---|---|---|---|
| Punta Gorda, FL | 2,792 | 1,808 | 3,763 | 1,005 | 48.05% | -803 | -21% |
| Santa Fe, NM | 5,231 | 1,939 | 6,584 | 851 | 29.45% | -1,088 | -17% |
| Myrtle Beach, SC | 17,616 | 4,830 | 21,480 | 2,918 | 22.49% | -1,912 | -9% |
| Colorado Springs, CO | 46,955 | 7,345 | 54,915 | 3,995 | 13.38% | -3,350 | -6% |
| Austin, TX | 259,258 | 34,846 | 299,550 | 18,185 | 11.63% | -16,661 | -6% |
These markets all have significant construction pipelines, with a high number of units scheduled to hit the market relative to current supply and relative to expected demand.
On the other hand, many cities, which I found to be smaller cities, are still doing relatively well.
| City | EoY 2024 Demand | Gross Delivered Units 2023/2024 | EoY 2024 Inventory Units | Sum of Absorption Units | Delivered/Inventory | Net Absorption | Net Absorption/Inventory |
|---|---|---|---|---|---|---|---|
| Missoula, MT | 4,741 | 179 | 5,043 | 373 | 3.55% | 194 | 4% |
| Athens, GA | 10,822 | 55 | 12,018 | 362 | 0.46% | 307 | 3% |
| Midland, TX | 15,722 | 238 | 17,083 | 621 | 1.39% | 383 | 2% |
| Provo, UT | 17,645 | 1,855 | 19,518 | 2,173 | 9.50% | 318 | 2% |
| Topeka, KS | 8,825 | 5 | 9,682 | 126 | 0.05% | 121 | 1% |
Missoula, Montana; Athens, Georgia; Midland, Texas; Provo, Utah; and Topeka, Kansas, all have solid net absorption, and their construction pipelines are very reasonable relative to current inventory levels. To me, these cities have a much smaller risk of vacancy and rent declines.
Every market is unique, and I am just showing a few examples of markets at risk and not at risk. But I encourage you to do some research yourself and identify how your market is doing in terms of construction. You can find lots of good data for free on the St. Louis Federal Reserve website or just by googling absorption data for your local area.
Conclusion
Multifamily properties are seeing a supply glut hit the market at an inopportune time, where rising interest rates are already putting downward pressure on prices and cash flow pressure on operators. As such, 2023 and 2024 could shape up to be difficult years in the multifamily space for current operators.
The important thing to note here is that the supply glut and demand shortage will likely be short-term. Long-term building and demographic trends support strong demand for multifamily rental units well into the future, which bodes well for investors. For example, a recent study shows that the U.S. needs 4.3 million more multifamily units in the coming 12 years to meet demand. Household formation is likely down right now due to short-term economic conditions. Inflation is negatively impacting renters’ spending power, and economic uncertainty is stopping young Americans from forming their own households. It’s unclear when this economic difficulty will end, but when it does, demand will likely pick back up.
Given this, investors could have good buying opportunities in the coming months and years. With cap rates likely to rise, prices for multifamily should go down. If NOI also drops due to oversupply issues, that will push prices down even further. This could allow inventors with some dry power to get into multifamily at attractive prices, but remember—this is a risky time. Be careful not to buy just anything and to understand the market dynamics in your local area in detail.
Build your wealth with multifamily houses
Learn how to become a millionaire by investing in multifamily houses! In this two-volume set, The Multifamily Millionaire, Brandon Turner and Brian Murray inspire and educate you into becoming a millionaire.
Note By BiggerPockets: These are opinions written by the author and do not necessarily represent the opinions of BiggerPockets.

